This lab introduces photogrammetric operations of aerial photographs and satellite imagery. The lab consists of three parts. Part one deals with calculating scales, area measurements, and relief displacement from an aerial photo. Part 2 details the creation of anaglyph images with the use of a DSM and a DEM. Part 3 consists of orthorectifying a photo and performing triangulation on it.
Methods
Part 1: Calculating Scales, Area Measurements, and Relief Displacement
Scale
This first section consisted of calculating the scale for an aerial photograph of Eau Claire. The ground distance between two different points on the map was given to be 8822.47 ft. Then, the distance on the map (2.6875 in) was measured on the map between the two points. To calculate the scale, the equation Scale = (photo distance) / (real world distance) was used. The real world distance was converted to inches and then the variables were inserted into the equation: Scale =2.6875 in / 105,869.64 in. Then the equation was simplified Scale =1 in / 39,393.3544 in. The last step before getting the scale is to drop the units and round the scale to the nearest hundred. Then, the scale of a second image was calculated. This time, the focal length, and the height of the camera was given. This scale was determined following a similar simplification processes as before, but this time the equation used was Scale = (focal length of camera lens) / (flying height of aircraft above surface). The elevation of Eau Claire (796 ft) was used to determine the flying height of the aircraft above the surface. The focal length was given as 152 mm. The altitude of the aircraft was 20,000 ft above sea level when the photo was taken. Plugging this into the equation: Scale = (152 mm) / (20,000 ft - 796 ft). This is simplified to then: Scale = 152 mm / 5,853,379.07 mm and then to Scale = 1 mm / 38,509.07 mm. Both of these scales were then simplified to ratio scales and rounded to the nearest hundred.
Area
The area and perimeter of a gravel pit / lagoon was measured in Erdas using the Measure Perimeters and Areas tool. This tools was used to digitize the lagoon / gravel pit, so that the area and perimeter could be calculated. The area was measured in ha and acres, and the perimeter was calculated in meters and miles.
Relief Displacement
Next, relief was calculated for a smoke stack at the heating plant near the upper campus of UW-Eau Claire. The scale of the photograph was given (1:3,209) along with the height of the aerial camera above the local datum (3,980 ft). The equation used to calculate the relief is Relief Displacement = [( photo radial distance of top of the displaced object from principal point)*(height of object in real life)] / (height of camera above local datum). To find the height of the object, the object was measured in the photograph and the map scale was accounted for. The height of the object in the photo was measured to be .375 in, which means that the real world height of the object is 1,203.375 in. The radial distance from the top of the smoke stack was 9.25 in. These variables were then plugged into the equation as such: Relief Displacement = [(9.25 in)*(1,203.375in)] / (47,760 in). This equation was then simplified and solved. The calculated relief displacement for the smoke stack was then used to determine what kind of adjustment should be made to the smoke stack in relation to the principal point.
Part 2: Anaglyph Images
Two anaglyph images were created in this part of the lab. One was created using a DEM as the input DEM and another was created using a DSM as the input DEM. To create the images, the Anaglyph Generation tool was used. This can be seen below in figure 4.0 for the anaglyph image for which the DEM was used as the input image. The anaglyph image created using the DSM was done using the same tool, but this time instead of inputting the DEM as the input DEM, a DSM was used. The outputs of these tools was made sure to be saved in the Lab7 data output folder.
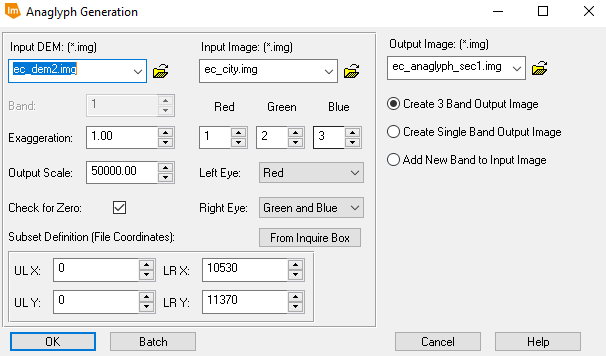 |
| Fig 4.0: Anaglyph Generation Tool used with a DEM as the input |
Part 3: Orthorecification
This part of the lab consists of orthorectifiying two SPOT images in palm beach California using Lecia Photogrammetric Suite (LPS) in Erdas Imagine. This will be done by orthorectifying one distorted image to two different images which are already orthorectified. This processes consists of multiple parts:
1. Create a New Project and Select a Horizontal Reference Source
2. Collect GCPs
3. Generate Automatic Tie Point Collection
4. Triangulate the Images
5. Orthorectify the Images
1. Create a New LPS Project
This was done by navigating to Toolbox → Imagine Photogrammetry and creating a a new block file using the Polynomial-based Pushbroom geometric model category. Then, the projection UTM Clarke 1866 Nad27 (CONUS) UTM Zone 11 North was set.
2. Collect GCPs
To do this, the first SPOT image was brought into the block file. Then, the reference information was verified. This changed the status of the the bar showing the readiness of the image for orthorectifying as shown below in figure 4.1.
 |
| Fig 4.1 Status bar |
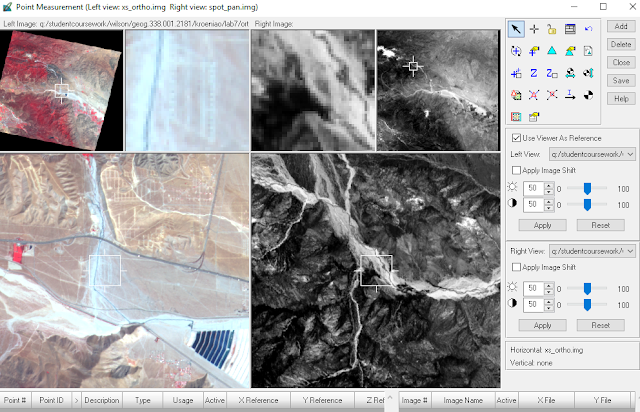 |
| Fig 4.2: Point Measurement Tool Window Before Adding GCPs |
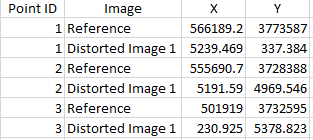 |
| Fig 4.3: First 3 GCP Placement |
Next, the vertical values of these GCPs were calculated. This was done by using the Reset Vertial Reference Source icon. Then a DEM was inserted in the DEM drop-down list from the authors University's folder. After the DEM is brought in, the z values are calculated by clicking on the
Update Z Values on Selected Points. Now, the GCPs must be collected for the second image. This was done by adding a new frame in the Photogrammetry Project Manager. Then, the GCP coordinates were entered using a process similar to that for the first inputting the GCPs in the first image. The same GCPs in the first distorted image were used in the second distorted image when possible.
3. Generate Automatic Tie Point Collection
Tie point collection is performed on the overlapping areas of the two distorted images. Tie points were created by first clicking on the Sutomatic Tie Point Generation Properties icon in the Point Measurement Window. Then, some properties were changed in the pop-up dialog box and the tie points were generated by clicking on Run. An important property altered was the intended number of points/ image field. This was changed to 40. After the tie points were created, the accuracy of them were checked by clicking on a reference cell in the list of GCPs and making sure that the point location was identical in both images.
4. Triangulate the Images
To do this, the Edit - Triangulation Properties button was clicked on. This opened up the triangulation dialog. In this dialog, some properties were altered, including setting the Itereation with Relaxation value to 3, changing the type of ground point type to Same weighted values, and changing the X, Y, and Z number field values to 15. These were changed because the spatial resolution of the main reference image is 20 meters. Using the value of 15 makes sure that the accuracy of the GCPs is about 15 meters. Then, the Run button was clicked on to run the triangulation. After this ran, a Triangulation Summary was opened from which a report was created as a .txt file by clicking on the Report button. After the triangulation, the status of the status bar changed as seen below in figure 4.4.
5. Orthorectify the Images
This was done by clicking on the Start Ortho Resampling Process icon which opened an Ortho Resampling window. In this window, the DEM was inserted into the DTM source, and the output cell size was changed to 10 for both X and Y. Also, the resampling method was changed to Bilinear Interpolation. Then, the second image to be orthorectified was brought in through the Add Single Output window by clicking on the Add button. Then, the Orthorectification was finally ready be run. This was done by clicking on the OK button. After this is done, the status bar looked like it does below in figure 4.5.
Part 1: Calculating Scales, Area Measurements, and Relief Displacement
The scale of the first image is 1 : 39,400. Although technically calculated to be 1 : 39,393.3544 using the equation, scales are usually rounded to the nearest hundred scale degree. This is because the elevation of the features used causes there to be slight margin of error. A scale of 1 : 39,400 means that one unit on the map is 39,400 of those units in the real world. An example is a distance of 1 cm on the map is 39,400 cm in the real world.
The scale of the second image is 1: 38,500. Although technically calculated to be 1 : 38,509.07, once again the scale was rounded because of possible error. This scale means that the image used to calculate the first scale has a smaller scale than the image which was used to calculate the second scale.
The area of the lagoon is 37.8091 ha or 93.4283 acres. The perimeter of the lagoon is 4,109.87 meters or 2.553755 miles. This doesn't allow for much analysis about the lagoon by itself, but this data could be combined with other data such as watersheds to see how much the lagoon could rise if a certain amount of rain fell in the watershed.
The result of the relief displacement is .233 in. This relief value can be used to determine the new location of the top of the smoke stack. In relation to the principal point, the top of the smoke stack should be moved towards the principal point 0.233 inches. This is because before correcting for relief displacement, the smoke stack is leaning away from the principal point, and is at a higher elevation than it.
Part 2: Anaglyph Images
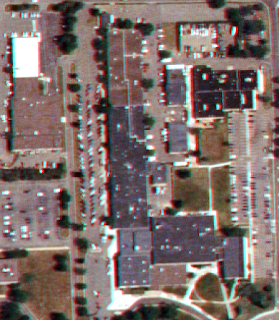
To interpret the anaglyph images, one must use Polaroid glasses, otherwise the image will look like it's in 2D. Figures 4.6 and 4.7 shows the result of the first anaglyph image created by using the DEM as the input. In this photo, some features are displayed well, but others are not. In general, man-made features such as buildings appear to be flat with the surface. This is because the DEM was used as an input. A DEM represents the bare ground elevation of the earths surface, but the aerial imagery include other surface features. Therefore, features which rise above the ground will be misrepresented. Figure 4.6 shows the whole image, and figure 4.7 shows a zoomed in portion.
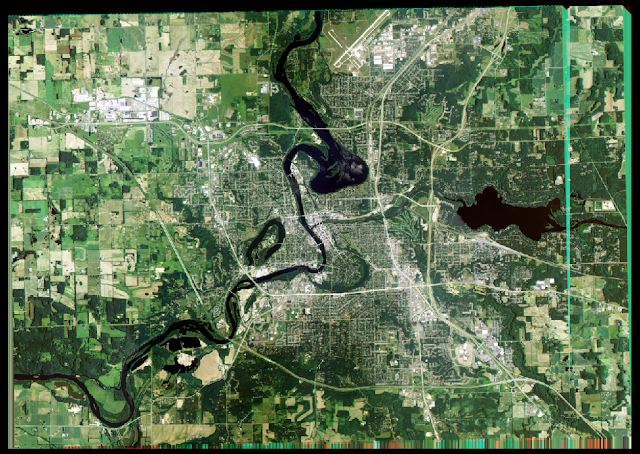
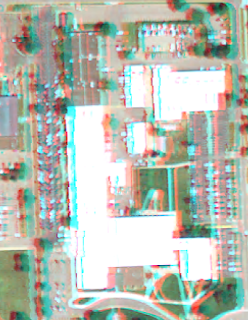
Figure 4.8 shows the result of the second anaglyph image created by using the DSM as the input. This anaglyph image displays the features in the aerial image much better. This is because the DSM was used as the input. A DSM is used to model the surface of the first returns of objects, which is also what the aerial imagery visible shows. As a result, now buildings such as Towers South hall appear to be very tall as they are actually. Figure 4.8 shows the entire output image, and figure 4.9 shows a zoomed in portion. The difference between using the DEM as an input and the DSM as an input can really be seen in the zoomed in images.
Part 3: Orthorecification
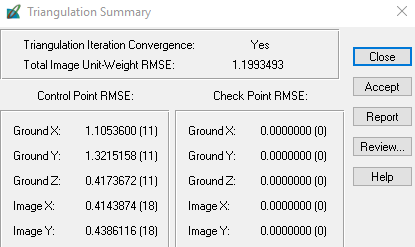
Figure 4.10 shows Triangulation Summary window which resulted from running the triangulation in part 3. This shows the RMS error for the X, Y, and Z values of the overall GCPs. RMS error was held under 1.5 for all the GCP values.
Figure 4.11 shows the result of part 3 which are the two orthorectified images. These images line up so nicely that they look like they have been mosaicked. The spatial accuracy of the two images is very high. This can be seen by looking at the boundary between the two images. The transision between the images is seamless. If there wasn't a visible line between the images, one would be unable to tell where the boundary of the images would be.
Sources
Agriculture Natural Resources Conservation Service, 2010.
National Agriculture Imagery Program (NAIP), 2005. United Sates Department of Agriculture
Digital Elevation Model (DEM) for Eau Claire, WI United States Department of Agriculture
Digital elevation model (DEM) for Palm Spring, CA, Erdas Imagine, 2009.
Lidar-derived surface model (DSM) of Eau Claire and Chippewa Eau
Claire County and Chippewa County 2017.
National Aerial Photography Program (NAPP) 2 meter images, Erdas Imagine, 2009.
Spot satellite images, Erdas Imagine, 2009.
Update Z Values on Selected Points. Now, the GCPs must be collected for the second image. This was done by adding a new frame in the Photogrammetry Project Manager. Then, the GCP coordinates were entered using a process similar to that for the first inputting the GCPs in the first image. The same GCPs in the first distorted image were used in the second distorted image when possible.
3. Generate Automatic Tie Point Collection
Tie point collection is performed on the overlapping areas of the two distorted images. Tie points were created by first clicking on the Sutomatic Tie Point Generation Properties icon in the Point Measurement Window. Then, some properties were changed in the pop-up dialog box and the tie points were generated by clicking on Run. An important property altered was the intended number of points/ image field. This was changed to 40. After the tie points were created, the accuracy of them were checked by clicking on a reference cell in the list of GCPs and making sure that the point location was identical in both images.
4. Triangulate the Images
To do this, the Edit - Triangulation Properties button was clicked on. This opened up the triangulation dialog. In this dialog, some properties were altered, including setting the Itereation with Relaxation value to 3, changing the type of ground point type to Same weighted values, and changing the X, Y, and Z number field values to 15. These were changed because the spatial resolution of the main reference image is 20 meters. Using the value of 15 makes sure that the accuracy of the GCPs is about 15 meters. Then, the Run button was clicked on to run the triangulation. After this ran, a Triangulation Summary was opened from which a report was created as a .txt file by clicking on the Report button. After the triangulation, the status of the status bar changed as seen below in figure 4.4.
 |
| Fig 4.4: Status of Status Bar After Triangulation |
This was done by clicking on the Start Ortho Resampling Process icon which opened an Ortho Resampling window. In this window, the DEM was inserted into the DTM source, and the output cell size was changed to 10 for both X and Y. Also, the resampling method was changed to Bilinear Interpolation. Then, the second image to be orthorectified was brought in through the Add Single Output window by clicking on the Add button. Then, the Orthorectification was finally ready be run. This was done by clicking on the OK button. After this is done, the status bar looked like it does below in figure 4.5.
 |
| Fig 4.5: Status Bar After Orthorectification |
Results
Part 1: Calculating Scales, Area Measurements, and Relief Displacement
The scale of the first image is 1 : 39,400. Although technically calculated to be 1 : 39,393.3544 using the equation, scales are usually rounded to the nearest hundred scale degree. This is because the elevation of the features used causes there to be slight margin of error. A scale of 1 : 39,400 means that one unit on the map is 39,400 of those units in the real world. An example is a distance of 1 cm on the map is 39,400 cm in the real world.
The scale of the second image is 1: 38,500. Although technically calculated to be 1 : 38,509.07, once again the scale was rounded because of possible error. This scale means that the image used to calculate the first scale has a smaller scale than the image which was used to calculate the second scale.
The area of the lagoon is 37.8091 ha or 93.4283 acres. The perimeter of the lagoon is 4,109.87 meters or 2.553755 miles. This doesn't allow for much analysis about the lagoon by itself, but this data could be combined with other data such as watersheds to see how much the lagoon could rise if a certain amount of rain fell in the watershed.
The result of the relief displacement is .233 in. This relief value can be used to determine the new location of the top of the smoke stack. In relation to the principal point, the top of the smoke stack should be moved towards the principal point 0.233 inches. This is because before correcting for relief displacement, the smoke stack is leaning away from the principal point, and is at a higher elevation than it.
Part 2: Anaglyph Images
To interpret the anaglyph images, one must use Polaroid glasses, otherwise the image will look like it's in 2D. Figures 4.6 and 4.7 shows the result of the first anaglyph image created by using the DEM as the input. In this photo, some features are displayed well, but others are not. In general, man-made features such as buildings appear to be flat with the surface. This is because the DEM was used as an input. A DEM represents the bare ground elevation of the earths surface, but the aerial imagery include other surface features. Therefore, features which rise above the ground will be misrepresented. Figure 4.6 shows the whole image, and figure 4.7 shows a zoomed in portion.
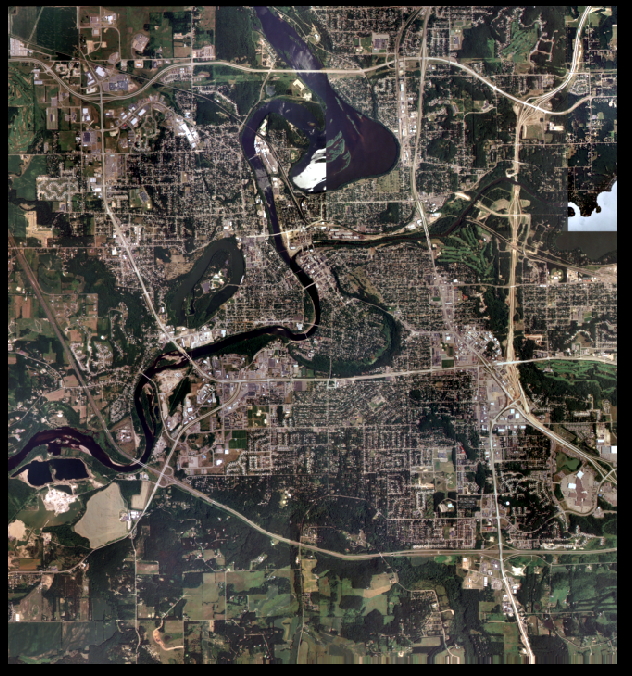 |
| Fig 4.6: Anaglyph DEM Full |
 |
| Fig 4.7: Zoomed in Anaglyph with DEM Input |
Figure 4.8 shows the result of the second anaglyph image created by using the DSM as the input. This anaglyph image displays the features in the aerial image much better. This is because the DSM was used as the input. A DSM is used to model the surface of the first returns of objects, which is also what the aerial imagery visible shows. As a result, now buildings such as Towers South hall appear to be very tall as they are actually. Figure 4.8 shows the entire output image, and figure 4.9 shows a zoomed in portion. The difference between using the DEM as an input and the DSM as an input can really be seen in the zoomed in images.
 |
| Fig 4.8: Zoomed Out DSM Anaglyph Image |
 |
| Fig 4.9: Zoomed in Anaglyph Image with DSM Input |
Figure 4.10 shows Triangulation Summary window which resulted from running the triangulation in part 3. This shows the RMS error for the X, Y, and Z values of the overall GCPs. RMS error was held under 1.5 for all the GCP values.
 |
| Fig 4.10: Triangulation Summary |
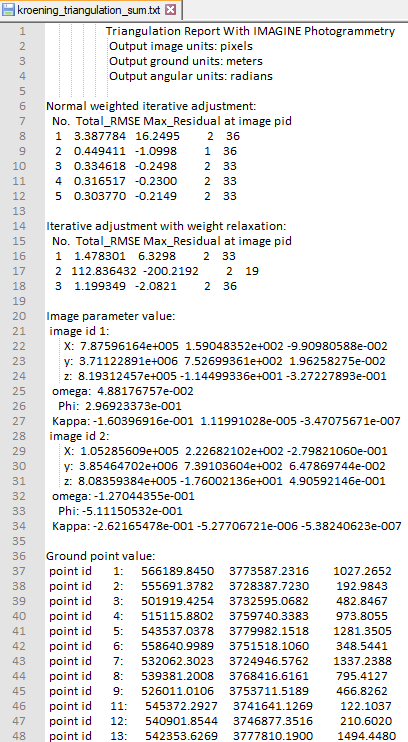
Figure 4.11 shows the first block of the Triangulation Summary report. The entire text document can be accessed here: Triangulation Summary Report. The report contains lots of data about the tie points and GCPs including their residual error, Image parameter values (the extent), normal weighted iterative adjustment, GCP coordinates.
 |
| Fig 4.11: Triangulation Summary Report |
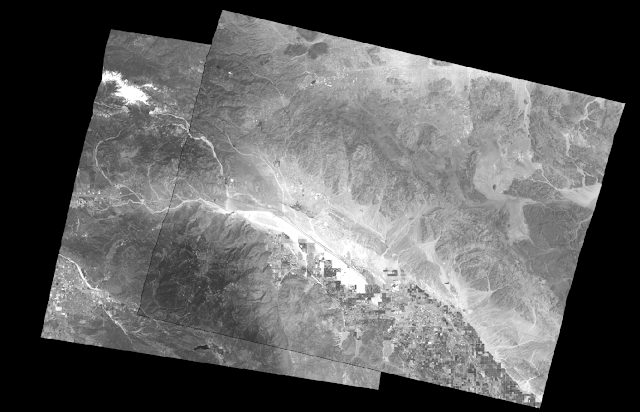
Figure 4.11 shows the result of part 3 which are the two orthorectified images. These images line up so nicely that they look like they have been mosaicked. The spatial accuracy of the two images is very high. This can be seen by looking at the boundary between the two images. The transision between the images is seamless. If there wasn't a visible line between the images, one would be unable to tell where the boundary of the images would be.
 |
| Fig 4.12: Orthorectified Images |
Figure 4.13 shown below is a video which helps to show the spatial accuracy of the orthorectified images. The video can be viewed in higher quality if expanded to full screen. In the video, the swipe tool is used to show that there is only a slight different in the overlap areas of the orthorectified images. The slight difference can be seen between 0:24 and 0:26. Between this time interval the slight difference can be seen in the river bed on the center right portion of the screen.
Fig 4.13: Using the Swipe Tool to Show the Orthorectified Images
Sources
Agriculture Natural Resources Conservation Service, 2010.
National Agriculture Imagery Program (NAIP), 2005. United Sates Department of Agriculture
Digital Elevation Model (DEM) for Eau Claire, WI United States Department of Agriculture
Digital elevation model (DEM) for Palm Spring, CA, Erdas Imagine, 2009.
Lidar-derived surface model (DSM) of Eau Claire and Chippewa Eau
Claire County and Chippewa County 2017.
National Aerial Photography Program (NAPP) 2 meter images, Erdas Imagine, 2009.
Spot satellite images, Erdas Imagine, 2009.
No comments:
Post a Comment